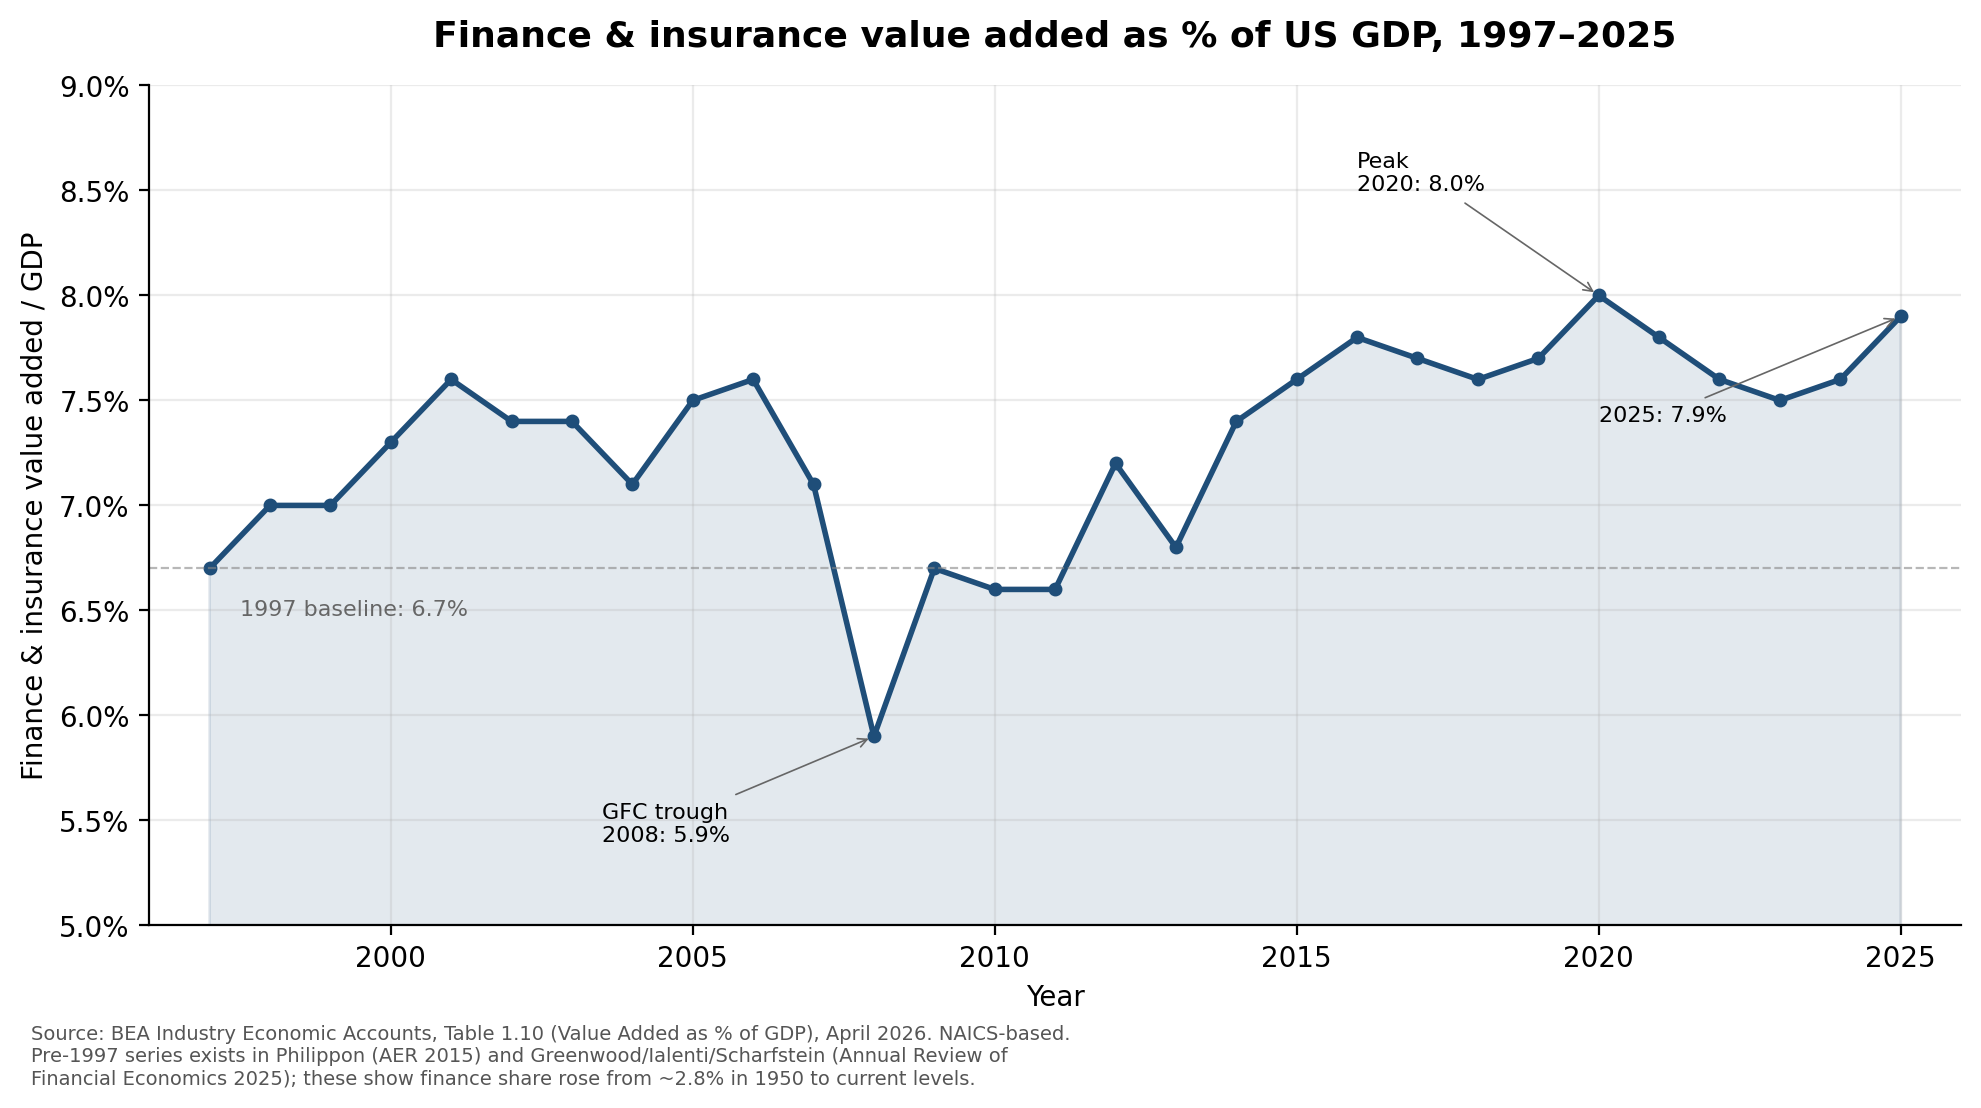
- 8 matplotlib charts generated from FRED, BEA, and primary 10-K data
- All chart Python scripts committed alongside PNGs for reproducibility
- Source data CSVs and BEA XLS pulled directly from public APIs
- Print MD updated to embed images inline (was: text-only callouts)
- PDF regenerated via tectonic (1.4MB with all charts)

Corrections from v1 prose (verified against actual data):
- Finance share of corporate profits peak: 34.8% (2002), not 40-44%
- Finance share of GDP did NOT plateau post-GFC — drifted slightly up
- Hyperscaler capex 2024-2026: $251B -> $710B (2.8x, not 3x)

Data gaps flagged in chart captions:
- Philippon 130-year unit-cost series replaced with BEA 1997-2025
- Carta middle-bucket percentages estimated from blog text
- Mega-round pre-2018 shares interpolated from round counts

Pentagon-Agent: Rio <244ba05f-3aa3-4079-8c59-6d68a77c76fe>
159 KiB
1981x1108px
159 KiB
1981x1108px